
How to Calculate ROI on an Automated Bagging Machine
Packaging Equipment / ROI Guide — Ref. YPX-ROI-014 · Rev. 4
How to Calculate ROI on an Automated Packaging Machine
A step-by-step guide for e-commerce fulfillment teams weighing an automated bagger or carton sealer against the cost of packing by hand.
Read time: 12 min · Applies to: Bagging & carton sealing · Level: Buyer-ready
A factory-tested, tabletop-class automated packaging machine — auto bagger or carton sealer — typically installs for around $8,000~$10,000, tax and freight included — well under what a full robotic packaging cell runs, and with little to no separate installation cost on top. Most fulfillment operations recover that within 12 months, and operations running more than 5,000 orders a day often see payback in under 6 months. This guide walks through the model in the order finance actually asks for it: baseline cost, how many units you actually need, total investment, savings — daily through annual — and payback.
What "ROI" Means for Automated Packaging Machine Buyers
Return on investment measures how much value the machine returns relative to what it costs to buy, install, and run — expressed as a percentage. ROI tells you whether the purchase is worth doing at all. Payback period tells you something related but different: how many months it takes for the machine's savings to fully offset the upfront cost. Buyers usually need both numbers — one to justify the purchase, one to schedule around it.
Calculate Your Current Manual Packaging Costs
Before any automation number means anything, you need a real baseline for what hand-packing costs today — not a rough guess pulled from memory during the meeting.
Baseline labor cost (annual) = number of packers × fully burdened hourly wage × hours worked per week × 52. Burdened wage means base pay plus payroll tax, benefits, and overtime — usually 20–35% above the number on a pay stub.
Build the number in labor-hours first, not headcount alone — it's the only way to compare a single 8-hour shift against a two-shift, 16-hour operation on equal footing, and it's the figure Step 3 needs anyway.
Method — Labor-Hours Cascade
Labor-Hours/Day = Packers × Shift Length (hrs)
Daily Labor Cost = Labor-Hours/Day × Burdened Hourly Wage
| You'll need | Burdened hourly wage per packer, current bags-per-hour by hand, shift length and shift count, current reject/reseal rate. |
|---|---|
| Watch for | Teams that use base wage instead of burdened wage understate labor cost by a fifth or more, which makes automation look weaker than it is. |
| Verify it | Cross-check the total against last quarter's actual payroll and material-usage reports for the packing station — not an estimate. |
Once you have that number, it's worth comparing it against published cycle rates for automated options — YPXPACK's packaging machine catalog lists speeds by model, which gives you a reference point before Step 2.
Total Investment Cost of the Machine
The number finance wants is the fully installed cost — but for factory-tested, plug-and-play tabletop units, that number is often close to the sticker price.
Total investment = equipment price (tax and freight included) + installation, if any + operator training + a first-year spares reserve.
Installation is usually where automation budgets quietly grow — except when the equipment is built to skip that step. YPXPACK's YPX-BD60C auto bagger and YPX-ZFD50B1 carton sealer both run all-electric — no compressed air, no air drops, typically no facility rewiring — and ship factory-tested as a complete unit. That's why an installed quote for tabletop-class equipment like this commonly lands around $8,000~$10,000 including tax and logistics; most of what you'd otherwise budget for installation simply doesn't apply. Larger, conveyor-integrated carton lines sit in a different footprint and price tier — confirm which category you're actually quoting.
That's specific to turnkey tabletop equipment, not a universal rule. Larger or more integrated systems — conveyor-fed lines, multi-machine cells — still carry real installation cost. Confirm which category you're quoting before building Step 2 around either assumption.
High-volume operations rarely run on a single unit regardless of per-unit price. Size the count before pricing anything else, then multiply it against the per-unit price above and add any shared costs — layout, conveyor integration, one training session that covers every machine — once, not per unit.
Method — Unit Sizing
Units Needed = Peak Daily Volume ÷ ( Rated Speed × Operating Hours/Day )
| You'll need | A written quote confirming what's included (tax, freight, factory testing), training hours × trainer rate, first-year spares budget. |
|---|---|
| Watch for | Assuming every vendor's quote is turnkey — or assuming none are. Confirm whether tax, freight, and installation are already priced in, or are separate line items still to come. |
| Watch for | Sizing to average daily volume instead of peak. A unit count that covers a normal Tuesday can fall short during a seasonal peak — exactly when the shortfall costs the most. |
| Verify it | Ask the vendor to itemize what's included in the quoted price. A number close to list price is a good sign for tabletop equipment; a large gap between quote and list is worth questioning. |
Quantify Your Annual Savings and Efficiency Gains
Net annual benefit = labor savings + material savings + value of added throughput + reduced downtime/rework cost. Build it from the daily number up — most teams find a daily figure easier to defend than a guessed-at annual one, and it's a straight multiplication from there.
Method — Savings Cascade
Daily Savings = Daily Manual Labor Cost − Daily Automated Labor Cost
Monthly Savings = Daily Savings × Working Days/Month
Net Annual Benefit = Monthly Savings × 12
An automated packaging machine running at several times manual hand-pack speed does more than replace one packer — it usually frees enough labor to redeploy a station's worth of people into picking or QC rather than cutting headcount outright. Most fulfillment teams shift labor first and cut second, which changes how the savings line gets reported but not the dollar total.
Machines with built-in job storage and packaging statistics — a common feature across YPXPACK's line — matter here for a second reason: they let you track actual throughput and reject rate against the estimate from week one, instead of waiting for quarter-end. Setup and changeover questions specific to a given bag or carton size are usually covered in the vendor's FAQ before you commit to a number.
| You'll need | Target cycle rate vs. current manual rate, expected film/bag waste reduction %, estimated downtime hours avoided per month. |
|---|---|
| Watch for | Crediting the full throughput gain as revenue. If bagging wasn't your bottleneck, faster bagging saves labor but doesn't add sales. |
| Verify it | Run the machine 30 days, then compare its own production counters against this estimate before locking numbers into Step 4. |
Apply the ROI Formula and Calculate Payback Period
With Steps 1–3 done, this is the full model — sizing, the savings cascade, and the two numbers finance actually asks for:
Monthly Savings = Daily Savings × Working Days/Month
Annual Net Benefit = Monthly Savings × 12 Formula — ROI & Payback ROI % = ( Net Annual Benefit ÷ Total Investment ) × 100
Payback (months) = Total Investment ÷ Monthly Savings
Use the worksheet below to run your own numbers — it's the same structure the worked example in the next section fills in.
| Line item | Your number |
|---|---|
| Units needed (peak volume ÷ rated speed × hours) | ____ units |
| Total investment (all units + install + training) | $ ____ |
| Daily labor cost — manual | $ ____ |
| Daily labor cost — automated | $ ____ |
| Daily savings | $ ____ |
| Monthly savings (× working days/month) | $ ____ |
| Net annual benefit (× 12) | $ ____ |
| ROI % | ____ % |
| Payback period | ____ mo |
| Watch for | Judging the purchase on Year 1 ROI alone. A good automation investment often shows a weak or negative Year 1 number because it's absorbing the one-time install cost — the real read comes from Year 2 onward. |
|---|---|
| Verify it | Re-run the formula assuming Year 2 and Year 3, with the one-time investment row set to zero. A project that looks marginal in Year 1 and strong from Year 2 on is usually still a good buy. |
For the underlying logic — why payback period and ROI aren't the same decision — see this payback period breakdown.
Worked Example: ROI Above the 5,000-Order Threshold
This is a simulated scenario built to show the model, not a real customer result — swap in your own Step 1–4 numbers for an answer that applies to your operation.
A regional fulfillment operation ships an average of 5,000 orders a day (peak 6,000) — just above the volume where payback typically drops under six months — packing by hand with 6 workers on one 8-hour shift at a fully burdened wage of $9/hour. It's evaluating a single tabletop auto bagger, illustrated here with YPXPACK's BD60C (~$8,000 including tax and freight, factory-tested with no meaningful installation cost), to automate the line, keeping two workers on staff to run and monitor it. An operation sealing cases instead of bagging poly mailers would run the same model against a machine like the ZFD50B1 carton sealer — the formulas don't change, only the rated speed and price you plug in.
Sizing: 6,000 ÷ (800 × 8) = 0.94 → round up to 1 unit — comfortably inside a single machine's rated capacity, even at peak.
| Item | Manual | Automated |
|---|---|---|
| Packing speed | ~120 pcs/hour/worker | 800 pcs/hour/unit |
| Units / workers required | 6 workers | 1 unit, 2 workers |
| Shift length | 8 hours | 8 hours |
| Labor-hours/day | 48 person-hrs | 16 person-hrs |
| Burdened wage | $9/hour | $9/hour |
| Daily labor cost | $432/day | $144/day |
| Line item | Illustrative value |
|---|---|
| Units needed | 1 unit |
| Total investment (equipment, tax & freight incl. + training) | $8,300 |
| Daily labor cost — manual | $432 |
| Daily labor cost — automated | $144 |
| Daily savings | $288 |
| Monthly savings (× 22 working days) | $6,336 |
| Net annual benefit (× 12) | $76,032 |
| ROI | ≈916% |
| Payback period | ≈6 weeks |
At this price point, ROI% stops being the useful number — it's mathematically correct but too large to mean much in a room. Payback period is the figure worth leading with here, and it holds up even under more conservative assumptions: halve the daily savings and payback still lands around 12 weeks, comfortably inside the six-month benchmark.
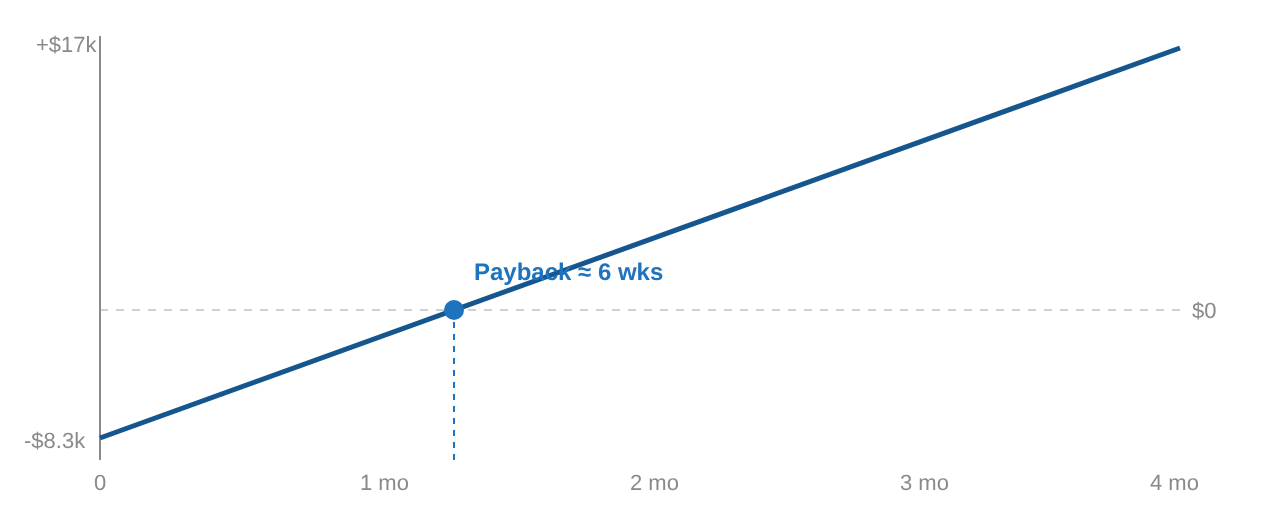
These figures are illustrative and assume near-full throughput utilization. Burdened wage rates vary enormously by region, and the same equipment can show a payback of a few weeks in one market and several months in another. Run Steps 1–4 with your own regional wage and volume numbers rather than borrowing this one, or request a quote to get real pricing to start from.
Beyond the Formula: What the Math Doesn't Capture
The ROI and payback numbers above only price what's easy to price. Four factors regularly tip a marginal calculation into an easy approval, even though none of them show up as a line item in Step 3.
- Output consistency. A machine runs at the same rate Monday morning and Friday afternoon. Manual output varies with skill, fatigue, and turnover — automation removes that variance right when it's hardest to staff around: peak season.
- Scalability. Adding volume to an automated line usually means adding a shift or a unit — a linear cost. Adding the same volume to a manual line means recruiting, training, and managing more people, a cost that grows faster than headcount alone suggests.
- Error and rework cost. Manual sealing and labeling mistakes generate returns, reships, and complaints that rarely get billed back to the packing line, but they're real. If your reject rate is tracked, run it through Step 3 as a material-savings line; if it isn't tracked yet, that's worth fixing before the next capital request.
- Training and turnover resilience. Simple, touchscreen-operated equipment can onboard a new operator in a shift, not weeks. On packing floors with high turnover, that alone can outweigh the labor-hours line in Step 3.
None of these belong in the ROI % you present to finance — they're not deterministic enough to defend under questioning. But they belong in the room when the decision gets made.
How to Maximize ROI From Your Automated Packaging Machine
- Right-size to peak volume, not average. Run the Units Needed formula from Step 2 against your peak day. Capacity sized for a normal Tuesday works until the first seasonal spike — and by then the shortfall costs more than the extra unit would have.
- Train two operators, not one. A single point of failure erases your uptime savings the first time someone calls in sick.
- Use the built-in counters from week one. Job-storage and packaging-statistics features track real bags-per-hour and reject rate immediately, instead of waiting for quarter-end reporting.
- Put preventive maintenance on the calendar, not the breakdown. Off-the-shelf, modular components keep replacement parts cheap — but only if they're swapped before they fail.
- Recheck the worksheet at 90 days. Replace every projected number in Step 4 with an actual one and re-run the formula.
YPXPACK puts over 15% of annual sales into R&D, which is the kind of detail worth checking for any vendor — reliability and parts availability affect your maintenance-cost line as much as the purchase price does.
Common Mistakes That Skew ROI Calculations
- Assuming every quote is turnkey — or assuming none are. Fix: confirm in writing whether tax, freight, and installation are already included. That gap is near-zero for factory-tested tabletop units and can be substantial for larger integrated lines.
- Using base wage instead of burdened wage. Fix: add 20–35% for payroll tax and benefits before calculating labor savings.
- Judging the purchase on Year 1 alone. Fix: run the formula through Year 2 and 3, once the one-time investment drops out.
- Assuming faster bagging means more revenue. Fix: confirm bagging was your actual bottleneck before counting throughput as a dollar benefit.
- Skipping the 90-day recheck. Fix: verify projected numbers against real production data before reporting a final ROI figure.
If the purchase is being financed rather than paid outright, the interest cost belongs in Step 2 as well — the SBA's 7(a) loan program is a common route for equipment financing and is worth a look before finalizing the investment number.
FAQ
What's a good payback period for an automated packaging machine?
For tabletop-class equipment specifically — bagger or carton sealer — under 12 months is typical, and operations running more than 5,000 orders a day often see payback in under six; equipment in this class is inexpensive enough that labor savings alone can cover it quickly. Larger industrial automation, like robotics or full conveyor lines, commonly runs a longer 12–24 month benchmark; the two categories aren't directly comparable.
Does ROI on a packaging machine include labor savings only?
No. Labor is usually the largest line, but material waste, downtime avoided, and rework/quality costs all belong in the net annual benefit figure from Step 3.
How fast does an automated packaging machine pay for itself in high-volume operations?
At more than 5,000 orders a day, well under six months is typical, and payback in a matter of weeks isn't unusual in higher labor-cost markets — the worked example above lands around six weeks. Below that volume threshold, payback still usually clears within 12 months, just with less margin.
How do I know if I need more than one machine?
Divide your peak daily volume by rated speed × operating hours per day, then round up — never down. A count that only covers an average day runs fine until the first seasonal spike, at which point the shortfall costs more than the extra unit would have.
Do I need a specific machine picked out before I can calculate ROI?
No — Steps 1 through 3 only need published spec sheets to estimate cycle rate and rough pricing. The number gets firmer once you have a real installed quote, which is why Step 2 asks for one before you finalize the figure. Requesting a quote is the fastest way to replace estimates with real numbers.
What if my ROI calculation comes back negative?
Check whether it's a Year 1 artifact first — the one-time investment often makes the first year look weak even on a good purchase. If Year 2 and 3 are still negative, the machine is likely oversized, underused, or priced above what your volume supports.
Next step
Get a firm number before you finalize Step 2
YPXPACK's tabletop auto baggers and carton sealers — including the BD60C and ZFD50B1 — run all-electric and typically install for around $8,000 including tax and freight, factory-tested with no meaningful installation cost to add on top.
Request a quote →YPXPACK Packaging Machine Co., Ltd · Guangzhou, China · Figures in this guide are illustrative estimates, not guarantees of performance or savings.

